Grab Your Wallets, Back-to-School Spending Soars to $1,642, Up 33% from Last Year
Spending on musical instruments and mobile devices up significantly;
Parents
to spend average of $505 on gadgets, with 92% saying kids use tech for
school
NEW YORK–(BUSINESS WIRE)–Summer may still be in full swing, but American families are already
getting ready to “fall” back into the upcoming school year. According to
the latest American
Express Spending & Saving Tracker, parents expect to
spend an average of $1,642 on back-to-school expenses this year, up
significantly from $1,239 in 2015.
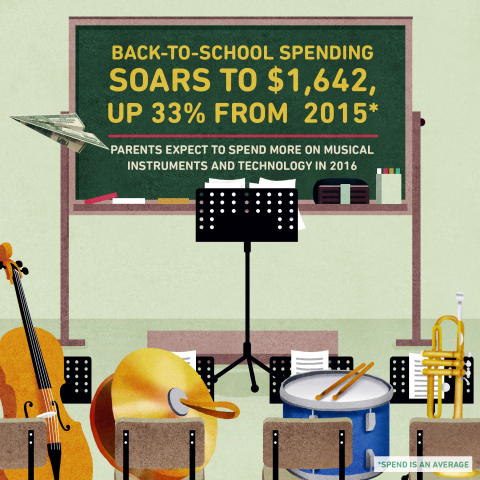

This coming school year, parents are expected to spend more on musical
instruments ($267 vs. $194 in 2015) and mobile devices ($172 vs. $125 in
2015), among other items also seeing a bump in spending:
| 2016 vs. 2015 | |||||||
| Plan to purchase | Average Spend | ||||||
| School supplies | 96% vs. 95% | $138 vs. $111 | |||||
| Clothing & accessories | 95% vs. 91% | $293 vs. $269 | |||||
| Shoes | 94% vs. 91% | $145 vs. $120 | |||||
| Outerwear/jackets | 82% vs. 75% | $126 vs. $106 | |||||
|
Technology |
59% vs. 46% | $505 vs. $466 | |||||
| Mobile devices | 52% vs. 41% | $172 vs. $125 | |||||
| Musical instruments | 34% vs. 24% | $267 vs. $194 | |||||
“When looking at trending data on this topic from the past five years,
2016 is showing the largest year-over-year increase for back-to-school
shopping,” said Jed Scala, Senior Vice President, Consumer Lending at
American Express. “This may be attributed to an ever-evolving
back-to-school shopping list and, perhaps, parents’ ability and
willingness to spend more when it comes to education and extracurricular
activities.”
Technology Takeover
As overall back-to-school spend increases, so does the widespread use of
gadgets in the classroom. A whopping 92% of parents report that their
kids are using tech for learning (vs. 82% in 2015). To accommodate this
gradual upswing in usage, six in 10 parents will purchase electronics
for the upcoming school year (59%), spending an average of $505 on
gadgets. Laptops will top the list of most popular back-to-school tech
supplies (28% vs. 22% in 2015), followed by tablets (23% vs. 19% in
2015) and cell phones (19% vs. 14% in 2015).
The use of smartphones for education has steadily increased over the
past four years, with 32% of parents agreeing that smartphones are a
go-to gadget for learning (vs. 29% in 2015, 24% in 2014 and 19% in
2013). Of those parents purchasing a cell phone for back-to-school
season, 73% will purchase a smart phone. However, whether kids are using
phones for personal or educational purposes, parents say the average
acceptable age for a cell phone remains at 12, consistent over the last
three years.
Budgeting 101 & Extracurricular Credit
As back-to-school spending rises, parents are finding it more important
to set budgets for certain school-related expenses. For example, 64% of
parents are setting a shopping budget for clothes (vs. 59% in 2015).
Despite setting these spending limits, 23% of parents say they would
still purchase clothing or a tech gadget if it exceeds their budget
because it’s an incentive for their kids to do well in school (59%,
significantly down from 74%), or it’s an easier trade-off than arguing
with their child (19%, significantly up from 3% in 2015).
In addition to setting budgets, 78% of parents are choosing to curb
their own spending to afford their kids’ back-to-school expenses (vs.
74% in 2015). Many parents plan to cut down on “extras” including
entertainment, such as plays, movies, sports games and concerts (42% vs.
38% in 2015); travel (40% vs. 32% in 2015); and extracurricular
activities, such as club memberships and personal hobbies (28% vs. 21%
in 2015).
While they may be cutting down on personal extracurriculars, nearly
nine-in-ten (87% – on par with 2015) parents say their child will
participate in at least one after-school activity. Overall, parents
expect to dish out an average total of $409 on these activities per
child (vs. $455 last year) with sports being the most popular (59% vs.
60% in 2015), followed by band, choir or music lessons (30% vs. 27% in
2015) and hobby groups (30% vs. 27% in 2015).
###
About the American Express Spending & Saving Tracker
The American
Express Spending & Saving Tracker research was completed online
among a random sample of 2,050 adults, including the general U.S.
population, an affluent demographic defined by a minimum annual
household income of $100,000, parents of children of grade school
children, and parents of college students. Interviewing was conducted by
Ebiquity from July 6 – 11, 2016. The results among parents of children
in kindergarten through college have an overall margin of error of +/-
2.5 at the 95 percent level of confidence.
About American Express
American Express is a global services company, providing customers with
access to products, insights and experiences that enrich lives and build
business success. Learn more at americanexpress.com
and connect with us on facebook.com/americanexpress,
foursquare.com/americanexpress, linkedin.com/company/american-express,
twitter.com/americanexpress,
and youtube.com/americanexpress.
Key links to products, services and corporate responsibility
information: charge
and credit cards, business
credit cards, Plenti
rewards program, travel
services, gift
cards, prepaid
cards, merchant
services, corporate
card, business
travel and corporate
responsibility.
About Ebiquity, Plc.
Ebiquity are independent marketing performance specialists. Ebiquity
enables brands across the world to make better informed decisions to
improve their brand and business performance across integrated
communications channels. Learn more at ebiquity.com.
Contacts
American Express
Jane Dileo, 212-640-8055


